
What drives restaurant kitchen equipment cost in 2026?
Restaurant kitchen equipment cost in 2026 is shaped by far more than product price alone. For financial decision-makers, understanding how automation, energy efficiency, material quality, supply chain shifts, and compliance requirements affect total investment is essential to controlling budgets and improving long-term returns. This guide explains the key cost drivers behind smarter purchasing decisions.
For CFOs, procurement managers, owners, and approval teams, the real question is not only how much a combi oven, refrigeration line, or prep station costs at purchase. The more strategic question is how restaurant kitchen equipment cost behaves across a 3-year to 10-year operating horizon.
In 2026, budget pressure is rising from multiple sides at once: labor shortages, stricter food safety expectations, utility volatility, project delays, and a stronger push toward smart and energy-efficient kitchens. That makes capital approval harder, but it also creates room for better returns when equipment decisions are based on total cost rather than sticker price.
The Main Forces Behind Restaurant Kitchen Equipment Cost in 2026
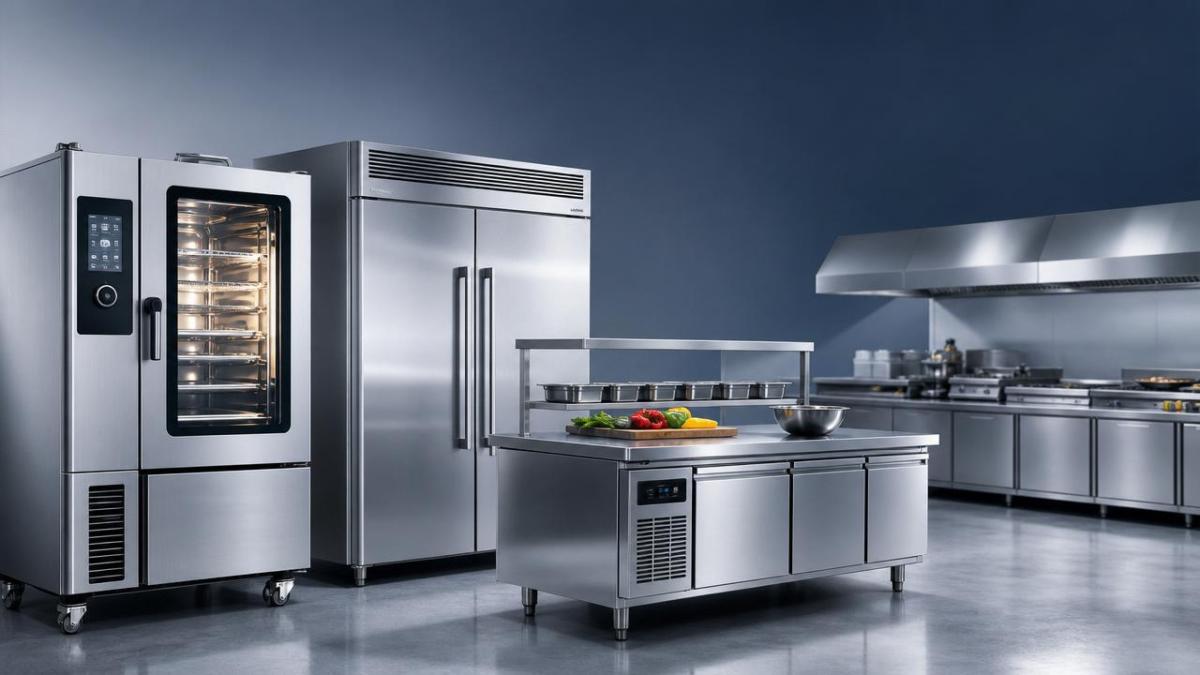
The biggest shift in restaurant kitchen equipment cost is that equipment categories are no longer priced mainly by metal, motor, and basic fabrication. In many cases, 5 cost layers now matter at the same time: hardware, controls, installation, compliance, and long-term operating performance.
1. Automation adds capital cost but can reduce labor dependency
Automated fryers, programmable combi ovens, smart holding cabinets, and integrated dishwashing systems often carry a 15% to 40% higher initial price than conventional units. However, they may reduce repetitive labor steps, training time, and cooking variability.
For finance teams, that means restaurant kitchen equipment cost should be reviewed against labor savings per shift. A unit that saves 20 to 30 minutes per day across 2 stations can justify a higher purchase price much faster than expected.
Where automation usually changes the budget
- Digital controllers and sensors
- Recipe programming and touchscreen interfaces
- Auto-cleaning or self-diagnostics functions
- Connectivity with kitchen management systems
2. Energy efficiency is now a financial variable, not a technical detail
Energy-efficient kitchen equipment often costs more upfront, but utility savings can materially affect payback. For example, moving from older refrigeration or cooking equipment to high-efficiency alternatives may cut electricity or gas consumption by 8% to 20%, depending on operating hours and kitchen load.
Restaurants operating 12 to 16 hours per day usually see this cost driver more clearly than low-volume sites. In high-throughput kitchens, small efficiency gains per hour become meaningful over 36 to 60 months.
3. Material quality directly affects replacement cycles
Stainless steel grade, insulation quality, compressor durability, burner design, and hinge construction all influence restaurant kitchen equipment cost. Lower-cost units may appear attractive during tender evaluation, but replacement intervals can be shorter by 2 to 4 years in demanding commercial environments.
This is especially relevant in coastal, humid, or heavy-washdown environments, where corrosion resistance matters. A lower purchase price can become expensive if downtime, repairs, and early replacement are not modeled at approval stage.
4. Supply chain and freight remain volatile cost drivers
Even as global sourcing becomes more diversified, restaurant kitchen equipment cost in 2026 still reflects freight rates, container availability, port congestion, and regional manufacturing shifts. Lead times for standard equipment may range from 2 to 8 weeks, while custom fabrication may stretch to 10 to 16 weeks.
Imported components such as electronic boards, compressors, thermostats, or specialty valves can also raise service risk later. Buyers should treat spare part availability as part of the original cost equation, not as a separate maintenance issue.
5. Compliance and installation can materially change final spend
Ventilation, fire suppression, drainage, electrical capacity, water treatment, and local code requirements may add 10% to 35% to total project cost. This is one of the most overlooked reasons why a quoted equipment package differs from the final approved budget.
A fryer line or combi oven may require upgraded gas lines, a dedicated breaker, hood balancing, or water filtration. If these scope items are discovered late, capital planning becomes reactive and margin control weakens.
How Financial Approvers Should Evaluate Total Cost Instead of Unit Price
The most effective way to assess restaurant kitchen equipment cost is to separate visible cost from operating cost. Financial approvers should compare at least 6 dimensions before signing off: acquisition, installation, utilities, labor impact, service frequency, and expected service life.
The table below shows a practical framework for comparing equipment options beyond headline price.
The key takeaway is simple: a lower equipment quote does not automatically mean lower restaurant kitchen equipment cost. If utility load, labor exposure, or repair risk increases, the budget advantage can disappear within 12 to 24 months.
Build a 4-part approval model
A practical approval model usually includes 4 layers. First, estimate acquisition and installation. Second, project utility consumption over 3 to 5 years. Third, include maintenance, parts, and downtime exposure. Fourth, assign value to labor efficiency and output consistency.
Recommended review checklist
- Confirm energy source, rated load, and daily operating hours.
- Check whether ventilation, water, or drainage upgrades are required.
- Review spare parts lead time, ideally under 7 to 14 days for common items.
- Estimate service life under actual kitchen intensity, not ideal conditions.
- Compare labor reduction per station or per shift where automation is involved.
Equipment Category Differences That Most Affect Budget Planning
Not all equipment categories behave the same way in budgeting. Cooking equipment, refrigeration, warewashing, ventilation, and prep systems each have different cost sensitivities. This matters because restaurant kitchen equipment cost is often driven by a few high-impact categories rather than the entire package equally.
Cooking line equipment
Ovens, ranges, fryers, griddles, and steam equipment are often influenced by heat source, output capacity, control sophistication, and ventilation needs. A programmable combi oven may cost substantially more than a standard convection solution, but it can combine 3 to 5 cooking functions in one footprint.
For multi-unit operators, that may reduce menu inconsistency and training complexity. Finance teams should weigh not just purchase price but also throughput, yield, and footprint efficiency per square meter.
Refrigeration and cold storage
Reach-ins, undercounters, walk-ins, and blast chillers are heavily affected by insulation quality, compressor efficiency, ambient operating range, and door cycle durability. In hot kitchens, poor refrigeration efficiency can raise both energy cost and food safety risk.
A unit that maintains stable temperature within a narrow operating band often costs more, but it may lower spoilage risk and service calls. For financial approvers, that is a hidden but important part of restaurant kitchen equipment cost.
Dishwashing and sanitation systems
Warewashing equipment is strongly affected by rack capacity, water recovery systems, booster heating requirements, and local sanitation standards. A machine with lower water use per cycle may save meaningful utility cost in sites running 100 to 300 racks daily.
Chemical dosing, filtration, and maintenance access also influence total cost. Lower-cost dish machines can create recurring spend through excessive water, detergent, and labor handling.
Ventilation and supporting infrastructure
Hoods, make-up air, ducting, and fire suppression are not always included in early equipment quotes, yet they can account for a significant share of project spend. In some kitchen renovations, infrastructure items represent 20% to 30% of the total package.
This is why finance teams should ask for a full-scope budget view early. Equipment price without infrastructure context rarely reflects real restaurant kitchen equipment cost.
Common Budget Risks and How to Control Them
Many kitchen projects go over budget not because equipment became suddenly expensive, but because risk was not mapped in advance. The most common overruns come from 5 areas: specification mismatch, hidden site work, delayed delivery, unclear warranty scope, and underplanned maintenance.
The following table highlights practical risk points that financial approvers should check before release of funds.
The financial lesson is that budget control starts before negotiation. A better specification package often creates more savings than a small unit-price discount because it reduces rework, delay, and lifecycle waste.
Mistakes that distort ROI calculations
One common mistake is using generic depreciation logic without testing actual replacement cycles. Another is excluding downtime cost from the model. If a critical refrigeration or cooking asset fails during high season, the cost impact extends beyond repair fees to lost revenue, labor disruption, and food safety exposure.
A second mistake is evaluating each item in isolation. Kitchen systems are interdependent. If a high-output cooking line is approved but ventilation and electrical support are underfunded, performance and compliance both suffer.
What Smarter Purchasing Looks Like in 2026
Smarter purchasing does not always mean buying premium equipment across the board. It means allocating capital where performance differences produce measurable returns, and simplifying where advanced features will not be used. This balanced approach gives finance teams more control over restaurant kitchen equipment cost.
Prioritize high-impact assets
Spending more on high-use, high-risk assets often makes sense. Examples include primary refrigeration, combi ovens, dishwashing systems, and production equipment running 8 to 16 hours daily. These assets influence energy use, labor efficiency, and operational continuity more than low-use support items.
Use standardization where possible
For growing restaurant groups, standardizing 60% to 80% of core equipment across locations can improve spare parts planning, staff training, and service efficiency. Standardization can also strengthen purchasing leverage and shorten installation learning curves.
Ask suppliers for cost visibility, not only quotations
A useful supplier discussion should cover at least 5 points: expected service life, utility consumption, installation scope, maintenance interval, and replacement part support. This helps approval teams compare real commercial value instead of comparing incomplete quotes.
Questions worth asking before approval
- What is the realistic lead time for standard delivery and custom fabrication?
- Which accessories or utilities are excluded from the quoted price?
- How often should preventive maintenance be scheduled: monthly, quarterly, or semiannually?
- Which components are most likely to fail first in heavy commercial use?
- Can this equipment integrate with future smart kitchen systems?
In 2026, restaurant kitchen equipment cost is driven by a combination of technology, efficiency, durability, logistics, and compliance. Financial approvers who evaluate lifecycle value instead of purchase price alone are better positioned to control capex, reduce operating risk, and support stronger long-term margins.
If you are planning a new kitchen, expansion, renovation, or multi-site procurement program, a structured cost review can reveal where premium investment is justified and where simplification is smarter. Contact us today to get a tailored equipment cost assessment, discuss product details, or explore more solutions for your commercial kitchen project.
Popular Tags
Kitchen Industry Research Team
Dedicated to analyzing emerging trends and technological shifts in the global hospitality and foodservice infrastructure sector.
Industry Insights
Join 15,000+ industry professionals. Get the latest market trends and tech news delivered weekly.
No spam. Unsubscribe anytime.
Hot Articles


Contact With us
Contact:
Anne Yin (Ceramics Dinnerware/Glassware)
Lucky Zhai(Flatware)